知名网站建设公司 北京国外产品推广平台
【附代码】判断线段是否相交算法(Python,C++)
文章目录
- 【附代码】判断线段是否相交算法(Python,C++)
- 相关文献
- 测试电脑配置
- 基础
- 向量旋转
- 向量缩放
- 向量投影
- 推导
- 点乘
- 定义
- 推导
- 几何意义
- 叉乘
- 定义
- 推导
- 几何意义
- 判断线段是否相交
- 代码
- C++
- Python
- 画图代码
- 测试结果
作者:小猪快跑
基础数学&计算数学,从事优化领域5年+,主要研究方向:MIP求解器、整数规划、随机规划、智能优化算法
如有错误,欢迎指正。如有更好的算法,也欢迎交流!!!——@小猪快跑
相关文献
测试电脑配置
博主三千元电脑的渣渣配置:
CPU model: AMD Ryzen 7 7840HS w/ Radeon 780M Graphics, instruction set [SSE2|AVX|AVX2|AVX512]
Thread count: 8 physical cores, 16 logical processors, using up to 16 threads
基础
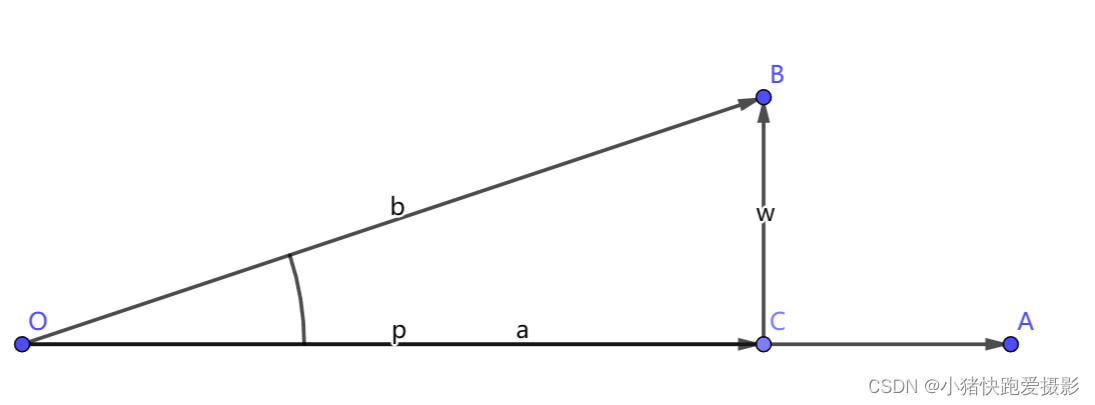
这里假设:
O A → = a ⃗ = ( x a , y a ) O B → = b ⃗ = ( x b , y b ) O C → = p ⃗ = ( x c , y c ) C B → = w ⃗ ∠ A O B = α \overrightarrow{OA} = \vec{a} = (x_a,y_a) \\ \overrightarrow{OB} = \vec{b} = (x_b,y_b) \\ \overrightarrow{OC} = \vec{p} = (x_c,y_c) \\ \overrightarrow{CB} = \vec{w} \\ ∠AOB = \alpha OA=a=(xa,ya)OB=b=(xb,yb)OC=p=(xc,yc)CB=w∠AOB=α
向量旋转
任意向量都能表示成:
( r cos α r sin α ) \left ( \begin{matrix} r\cos{\alpha} \\ r\sin{\alpha} \\ \end{matrix} \right ) (rcosαrsinα)
假设向量逆时针旋转了 β \beta β,那么我们容易知道旋转后向量是:
( r cos ( α + β ) r sin ( α + β ) ) \left ( \begin{matrix} r\cos({\alpha + \beta}) \\ r\sin({\alpha + \beta}) \\ \end{matrix} \right ) (rcos(α+β)rsin(α+β))
那么容易得到:
( r cos ( α + β ) r sin ( α + β ) ) = ( cos α − sin α sin α cos α ) ( r cos α r sin α ) \left ( \begin{matrix} r\cos({\alpha + \beta}) \\ r\sin({\alpha + \beta}) \\ \end{matrix} \right )= \left ( \begin{array}{rr} \cos{\alpha} & -\sin{\alpha} \\ \sin{\alpha} & \cos{\alpha} \\ \end{array} \right ) \left ( \begin{matrix} r\cos{\alpha} \\ r\sin{\alpha} \\ \end{matrix} \right ) (rcos(α+β)rsin(α+β))=(cosαsinα−sinαcosα)(rcosαrsinα)
于是旋转向量就是:
( cos α − sin α sin α cos α ) \left ( \begin{array}{rr} \cos{\alpha} & -\sin{\alpha} \\ \sin{\alpha} & \cos{\alpha} \\ \end{array} \right ) (cosαsinα−sinαcosα)
向量缩放
( r 0 0 r ) \left ( \begin{array}{rr} r & 0 \\ 0 & r \\ \end{array} \right ) (r00r)
向量投影
推导
主要利用 O C → \overrightarrow{OC} OC 和 C B → \overrightarrow{CB} CB 垂直,点积为0:
w ⃗ = b ⃗ − p ⃗ w ⃗ ⋅ p ⃗ = 0 } ⇒ ( b ⃗ − p ⃗ ) ⋅ p ⃗ = 0 p ⃗ = k a ⃗ } ⇒ ( b ⃗ − k a ⃗ ) ⋅ k a ⃗ = 0 p ⃗ = k a ⃗ } ⇒ p ⃗ = a ⃗ ⋅ b ⃗ a ⃗ ⋅ a ⃗ a ⃗ \left. \begin{array}{r} \left. \begin{array}{l} \vec{w}=\vec{b}-\vec{p} \\ \vec{w} \cdot \vec{p} = 0 \end{array} \right\} \Rightarrow (\vec{b}-\vec{p}) \cdot \vec{p} = 0\\ \vec{p} = k \vec{a} \end{array} \right\} \Rightarrow \left. \begin{array}{r} (\vec{b}-k \vec{a}) \cdot k \vec{a} = 0 \\ \vec{p} = k \vec{a} \end{array} \right\} \Rightarrow \vec{p} = \frac{\vec{a} \cdot \vec{b}}{\vec{a} \cdot \vec{a}} \vec{a} w=b−pw⋅p=0}⇒(b−p)⋅p=0p=ka⎭ ⎬ ⎫⇒(b−ka)⋅ka=0p=ka}⇒p=a⋅aa⋅ba
那么投影矩阵
P b ⃗ = p ⃗ = a ⃗ a ⃗ ⋅ b ⃗ a ⃗ ⋅ a ⃗ ⇒ P = a ⃗ a ⃗ T a ⃗ T a ⃗ \begin{array}{l} & P\vec{b} = \vec{p} = \vec{a} \frac{\vec{a} \cdot \vec{b}}{\vec{a} \cdot \vec{a}} \\ \Rightarrow & P = \frac{\vec{a}\vec{a}^T}{\vec{a}^T\vec{a}} \end{array} ⇒Pb=p=aa⋅aa⋅bP=aTaaaT
点乘
点乘(Dot Product)的结果是点积,又称数量积或标量积(Scalar Product)
定义
a ⃗ ⋅ b ⃗ = ∣ a ⃗ ∣ ∣ b ⃗ ∣ cos α \vec{a} \cdot \vec{b} = |\vec{a}||\vec{b}|\cos{\alpha} a⋅b=∣a∣∣b∣cosα
推导
那么如何用解析几何来表示呢?
我们其实可以把 a ⃗ \vec{a} a 旋转 α \alpha α 再缩放 ∣ b ⃗ ∣ / ∣ a ⃗ ∣ |\vec{b}|/|\vec{a}| ∣b∣/∣a∣ 倍,就是 b ⃗ \vec{b} b 了:
( ∣ b ⃗ ∣ ∣ a ⃗ ∣ 0 0 ∣ b ⃗ ∣ ∣ a ⃗ ∣ ) ( cos α − sin α sin α cos α ) ( x a y a ) = ( x b y b ) ⇒ ( ( x a cos α − y a sin α ) ∣ b ⃗ ∣ ( x a sin α + y a cos α ) ∣ b ⃗ ∣ ) = ( x b ∣ a ⃗ ∣ y b ∣ a ⃗ ∣ ) ⇒ ∣ a ⃗ ∣ ∣ b ⃗ ∣ cos α = x a x b + y a y b \begin{array}{l} &\left ( \begin{matrix} \frac{|\vec{b}|}{|\vec{a}|} & 0 \\ 0 & \frac{|\vec{b}|}{|\vec{a}|} \\ \end{matrix} \right ) \left ( \begin{array}{rr} \cos{\alpha} & -\sin{\alpha} \\ \sin{\alpha} & \cos{\alpha} \\ \end{array} \right ) \left ( \begin{matrix} x_a \\ y_a \\ \end{matrix} \right )= \left ( \begin{matrix} x_b \\ y_b \\ \end{matrix} \right ) \\ \Rightarrow & \left ( \begin{matrix} (x_a\cos{\alpha} - y_a\sin{\alpha})|\vec{b}| \\ (x_a\sin{\alpha} + y_a\cos{\alpha})|\vec{b}| \\ \end{matrix} \right )= \left ( \begin{matrix} x_b|\vec{a}| \\ y_b|\vec{a}| \\ \end{matrix} \right ) \\ \Rightarrow & |\vec{a}||\vec{b}|\cos{\alpha} = x_a x_b + y_a y_b \end{array} ⇒⇒ ∣a∣∣b∣00∣a∣∣b∣ (cosαsinα−sinαcosα)(xaya)=(xbyb)((xacosα−yasinα)∣b∣(xasinα+yacosα)∣b∣)=(xb∣a∣yb∣a∣)∣a∣∣b∣cosα=xaxb+yayb
几何意义
点乘的结果表示 a ⃗ \vec{a} a 在 b ⃗ \vec{b} b 方向上的投影与 b ⃗ \vec{b} b 的乘积,反映了两个向量在方向上的相似度,结果越大越相似。基于结果可以判断这两个向量是否是同一方向,是否正交垂直,具体对应关系为:
- a ⃗ ⋅ b ⃗ > 0 \vec{a} \cdot \vec{b} > 0 a⋅b>0 则方向基本相同,夹角在0°到90°之间
- a ⃗ ⋅ b ⃗ = 0 \vec{a} \cdot \vec{b} = 0 a⋅b=0 则正交,相互垂直
- a ⃗ ⋅ b ⃗ < 0 \vec{a} \cdot \vec{b} < 0 a⋅b<0 则方向基本相反,夹角在90°到180°之间
叉乘
叉乘(Cross Product)又称向量积(Vector Product)。
定义
a ⃗ × b ⃗ = ∣ a ⃗ ∣ ∣ b ⃗ ∣ sin α \vec{a} \times \vec{b} = |\vec{a}||\vec{b}|\sin{\alpha} a×b=∣a∣∣b∣sinα
推导
那么如何用解析几何来表示呢?
我们其实可以把 a ⃗ \vec{a} a 旋转 α \alpha α 再缩放 ∣ b ⃗ ∣ / ∣ a ⃗ ∣ |\vec{b}|/|\vec{a}| ∣b∣/∣a∣ 倍,就是 b ⃗ \vec{b} b 了:
( ∣ b ⃗ ∣ ∣ a ⃗ ∣ 0 0 ∣ b ⃗ ∣ ∣ a ⃗ ∣ ) ( cos α − sin α sin α cos α ) ( x a y a ) = ( x b y b ) ⇒ ( ( x a cos α − y a sin α ) ∣ b ⃗ ∣ ( x a sin α + y a cos α ) ∣ b ⃗ ∣ ) = ( x b ∣ a ⃗ ∣ y b ∣ a ⃗ ∣ ) ⇒ ∣ a ⃗ ∣ ∣ b ⃗ ∣ sin α = x a y b − x b y a \begin{array}{l} & \left ( \begin{matrix} \frac{|\vec{b}|}{|\vec{a}|} & 0 \\ 0 & \frac{|\vec{b}|}{|\vec{a}|} \\ \end{matrix} \right ) \left ( \begin{array}{rr} \cos{\alpha} & -\sin{\alpha} \\ \sin{\alpha} & \cos{\alpha} \\ \end{array} \right ) \left ( \begin{matrix} x_a \\ y_a \\ \end{matrix} \right )= \left ( \begin{matrix} x_b \\ y_b \\ \end{matrix} \right ) \\ \Rightarrow & \left ( \begin{matrix} (x_a\cos{\alpha} - y_a\sin{\alpha})|\vec{b}| \\ (x_a\sin{\alpha} + y_a\cos{\alpha})|\vec{b}| \\ \end{matrix} \right )= \left ( \begin{matrix} x_b|\vec{a}| \\ y_b|\vec{a}| \\ \end{matrix} \right ) \\ \Rightarrow & |\vec{a}||\vec{b}|\sin{\alpha} = x_a y_b - x_b y_a \end{array} ⇒⇒ ∣a∣∣b∣00∣a∣∣b∣ (cosαsinα−sinαcosα)(xaya)=(xbyb)((xacosα−yasinα)∣b∣(xasinα+yacosα)∣b∣)=(xb∣a∣yb∣a∣)∣a∣∣b∣sinα=xayb−xbya
几何意义
如果以向量 a ⃗ \vec{a} a 和 b ⃗ \vec{b} b 为边构成一个平行四边形,那么这两个向量外积的模长与这个平行四边形的面积相等。
判断线段是否相交
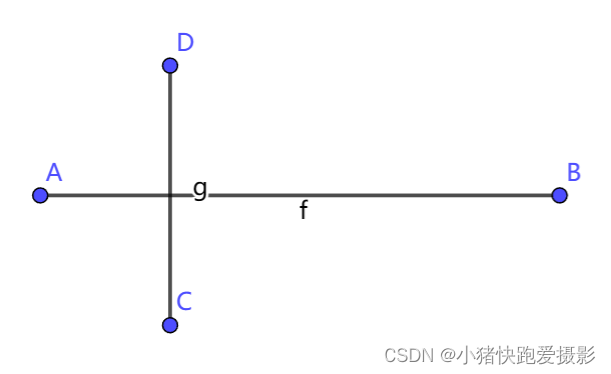
我们有了上面的基础后,其实思路就一下打开了!
其实我们只要想着 A B → \overrightarrow{AB} AB 的两边是 C C C 和 D D D ,那么也就是说 A B → × A D → \overrightarrow{AB} \times \overrightarrow{AD} AB×AD 和 A B → × A C → \overrightarrow{AB} \times \overrightarrow{AC} AB×AC 有正有负,同时呢 C D → × C A → \overrightarrow{CD} \times \overrightarrow{CA} CD×CA 和 C D → × C B → \overrightarrow{CD} \times \overrightarrow{CB} CD×CB 有正有负(这里要注意一下叉乘可能为0的情况,比如说 A A A 在 C D → \overrightarrow{CD} CD 上)。这里我们有正有负采用直接判断而不是相乘小于零,这是因为相乘可能存在数值溢出等问题。而且一般的,和零的判断比乘法快很多。
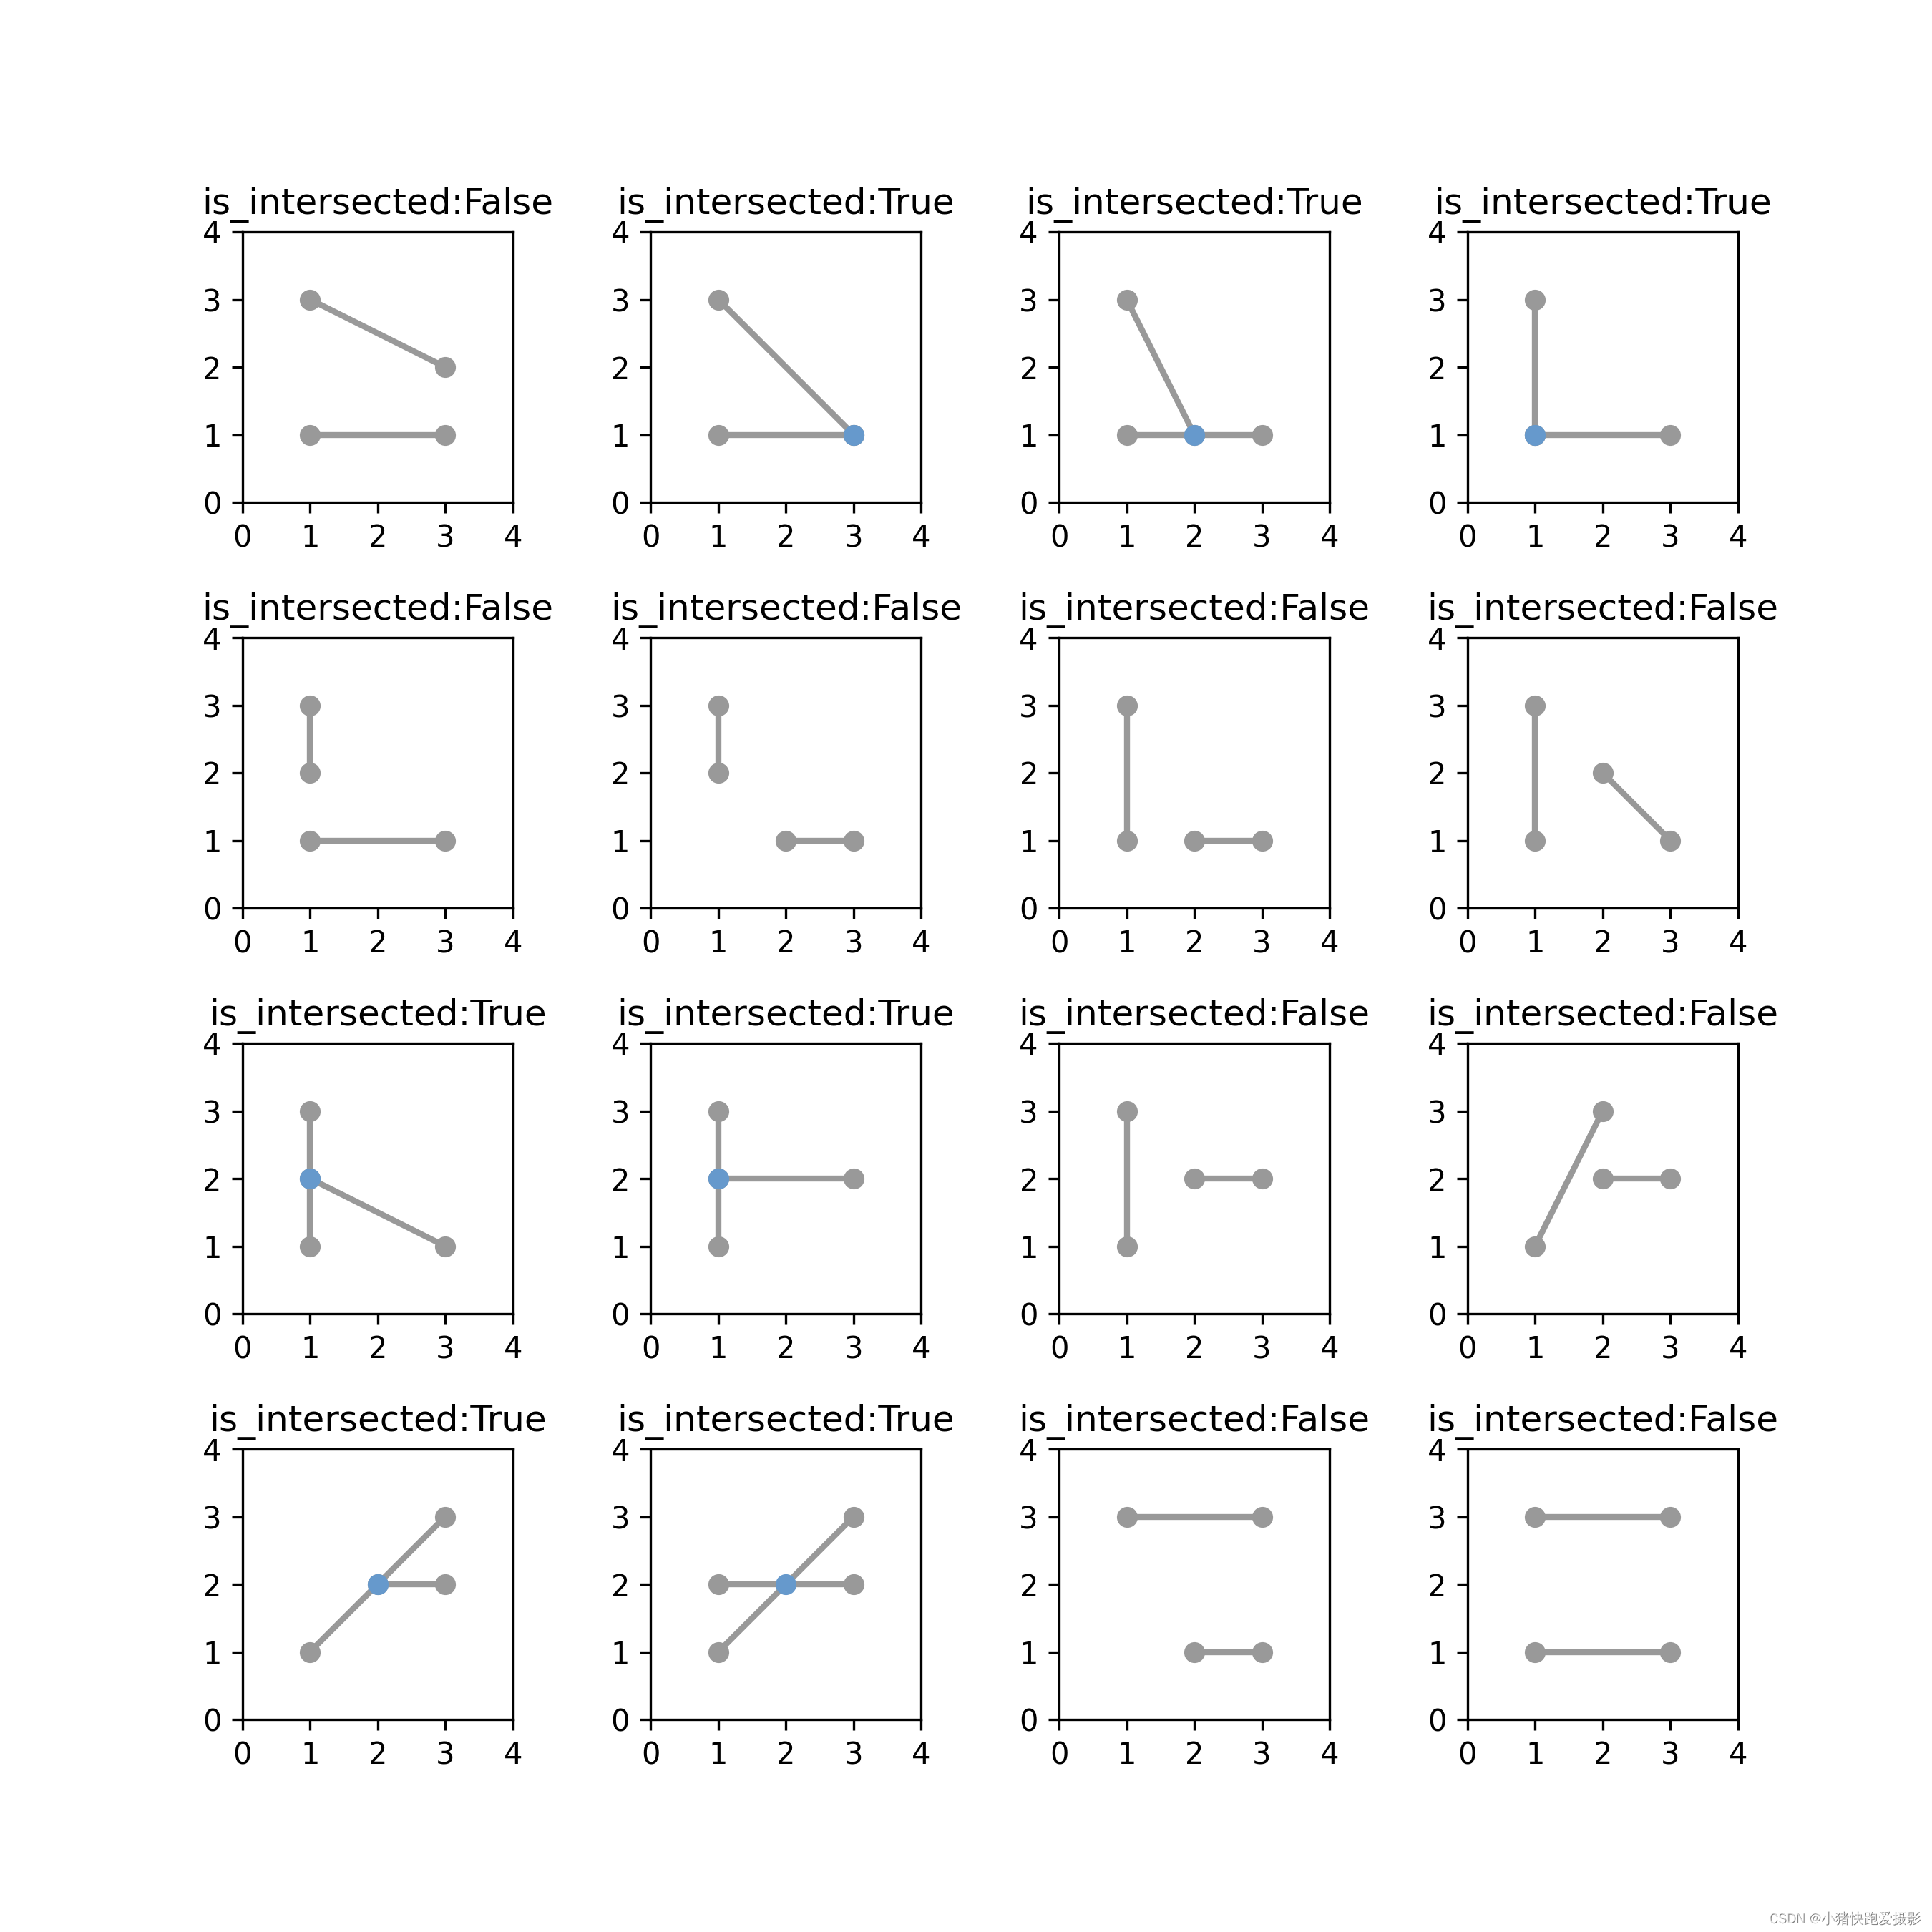
我们直接上测试用例看看效果!!!
代码
C++
#include <iostream>
#include <chrono>using namespace std;int cross_product(int x1, int y1, int x2, int y2) {// 计算向量 (x1, y1) 和向量 (x2, y2) 的叉积return x1 * y2 - x2 * y1;
}int dot_product(int x1, int y1, int x2, int y2) {// 计算向量 (x1, y1) 和向量 (x2, y2) 的点乘return x1 * x2 + y1 * y2;
}bool is_intersected(int x1, int y1, int x2, int y2, int x3, int y3, int x4, int y4) {/*判断线段 (x1, y1)-(x2, y2) 和线段 (x3, y3)-(x4, y4) 是否相交AB×ACAB×ADCD×CACD×CB*/if ((max(x1, x2) < min(x3, x4)) or (max(x3, x4) < min(x1, x2)) or (max(y1, y2) < min(y3, y4)) or (max(y3, y4) < min(y1, y2))) {return false;}int abx = x2 - x1;int aby = y2 - y1;int acx = x3 - x1;int acy = y3 - y1;int adx = x4 - x1;int ady = y4 - y1;int bcx = x3 - x2;int bcy = y3 - y2;int cdx = x4 - x3;int cdy = y4 - y3;int cp1 = cross_product(abx, aby, acx, acy);int cp2 = cross_product(abx, aby, adx, ady);int cp3 = cross_product(cdx, cdy, -acx, -acy);int cp4 = cross_product(cdx, cdy, -bcx, -bcy);// 如果两个叉积的乘积小于0,则两个向量在向量 (x1, y1)-(x2, y2) 的两侧,即线段相交if (((cp1 > 0 and 0 > cp2) or (cp1 < 0 and 0 < cp2) or cp1 == 0 or cp2 == 0) and((cp3 > 0 and 0 > cp4) or (cp3 < 0 and 0 < cp4) or cp3 == 0 or cp4 == 0)) {return true;}return false;
}int test(int n) {int res = 0;for (auto x1 = 0; x1 < n; x1++) {for (auto y1 = 0; y1 < n; y1++) {for (auto x2 = 0; x2 < n; x2++) {for (auto y2 = 0; y2 < n; y2++) {if (x1 == x2 and y1 == y2) {continue;}for (auto x3 = 0; x3 < n; x3++) {for (auto y3 = 0; y3 < n; y3++) {for (auto x4 = 0; x4 < n; x4++) {for (auto y4 = 0; y4 < n; y4++) {if (x3 == x4 and y3 == y4) {continue;}res += is_intersected(x1, y1, x2, y2, x3, y3, x4, y4);}}}}}}}}return res;
}int main() {auto start = std::chrono::high_resolution_clock::now();std::cout << test(7) << std::endl;auto finish = std::chrono::high_resolution_clock::now();std::chrono::duration<double> elapsed = finish - start;std::cout << "Elapsed time: " << elapsed.count() << " s\n" << std::endl;return 0;
}
Python
from time import time
import math
from numba import njit@njit
def cross_product(x1, y1, x2, y2):"""计算向量 (x1, y1) 和向量 (x2, y2) 的叉积"""return x1 * y2 - x2 * y1@njit
def dot_product(x1, y1, x2, y2):"""计算向量 (x1, y1) 和向量 (x2, y2) 的点乘"""return x1 * x2 + y1 * y2@njit
def is_intersected(x1, y1, x2, y2, x3, y3, x4, y4):"""判断线段 (x1, y1)-(x2, y2) 和线段 (x3, y3)-(x4, y4) 是否相交AB×ACAB×ADCD×CACD×CB"""if (max(x1, x2) < min(x3, x4)) or (max(x3, x4) < min(x1, x2)) or (max(y1, y2) < min(y3, y4)) or (max(y3, y4) < min(y1, y2)):return Falseabx = x2 - x1aby = y2 - y1acx = x3 - x1acy = y3 - y1adx = x4 - x1ady = y4 - y1bcx = x3 - x2bcy = y3 - y2cdx = x4 - x3cdy = y4 - y3cp1 = cross_product(abx, aby, acx, acy)cp2 = cross_product(abx, aby, adx, ady)cp3 = cross_product(cdx, cdy, -acx, -acy)cp4 = cross_product(cdx, cdy, -bcx, -bcy)# 如果两个叉积的乘积小于0,则两个向量在向量 (x1, y1)-(x2, y2) 的两侧,即线段相交if ((cp1 > 0 > cp2) or (cp1 < 0 < cp2) or cp1 == 0 or cp2 == 0) and ((cp3 > 0 > cp4) or (cp3 < 0 < cp4) or cp3 == 0 or cp4 == 0):return Truereturn Falsedef test(n):res = 0for x1 in range(n):for y1 in range(n):for x2 in range(n):for y2 in range(n):if x1 == x2 and y1 == y2:continuefor x3 in range(n):for y3 in range(n):for x4 in range(n):for y4 in range(n):if x3 == x4 and y3 == y4:continueres += is_intersected(x1, y1, x2, y2, x3, y3, x4, y4)return resif __name__ == '__main__':s = time()print(test(7))print(time() - s)
画图代码
# main.py
import matplotlib.pyplot as plt
from shapely.geometry import Point, LineString, Polygon
from shapely.plotting import plot_polygon, plot_points, plot_linefrom csdn_line_intersect import is_intersected
from figures import BLUE, GRAY, set_limitsfig = plt.figure(1, figsize=(9, 9), dpi=300)
fig.subplots_adjust(wspace=0.5, hspace=0.5)  # 调整边距和子图的间距ax = fig.add_subplot(4, 4, 1)
x1, y1, x2, y2 = 1, 1, 3, 1
x3, y3, x4, y4 = 1, 3, 3, 2
a = LineString([(x1, y1), (x2, y2)])
b = LineString([(x3, y3), (x4, y4)])
plot_line(a, ax=ax, color=GRAY)
plot_line(b, ax=ax, color=GRAY)
plot_points(a.intersection(b), ax=ax, color=BLUE)
ax.set_title(f'is_intersected:{is_intersected(x1, y1, x2, y2, x3, y3, x4, y4)}')
set_limits(ax, 0, 4, 0, 4)ax = fig.add_subplot(4, 4, 2)
x1, y1, x2, y2 = 1, 1, 3, 1
x3, y3, x4, y4 = 1, 3, 3, 1
a = LineString([(x1, y1), (x2, y2)])
b = LineString([(x3, y3), (x4, y4)])
plot_line(a, ax=ax, color=GRAY)
plot_line(b, ax=ax, color=GRAY)
plot_points(a.intersection(b), ax=ax, color=BLUE)
ax.set_title(f'is_intersected:{is_intersected(x1, y1, x2, y2, x3, y3, x4, y4)}')
set_limits(ax, 0, 4, 0, 4)ax = fig.add_subplot(4, 4, 3)
x1, y1, x2, y2 = 1, 1, 3, 1
x3, y3, x4, y4 = 1, 3, 2, 1
a = LineString([(x1, y1), (x2, y2)])
b = LineString([(x3, y3), (x4, y4)])
plot_line(a, ax=ax, color=GRAY)
plot_line(b, ax=ax, color=GRAY)
plot_points(a.intersection(b), ax=ax, color=BLUE)
ax.set_title(f'is_intersected:{is_intersected(x1, y1, x2, y2, x3, y3, x4, y4)}')
set_limits(ax, 0, 4, 0, 4)ax = fig.add_subplot(4, 4, 4)
x1, y1, x2, y2 = 1, 1, 3, 1
x3, y3, x4, y4 = 1, 3, 1, 1
a = LineString([(x1, y1), (x2, y2)])
b = LineString([(x3, y3), (x4, y4)])
plot_line(a, ax=ax, color=GRAY)
plot_line(b, ax=ax, color=GRAY)
plot_points(a.intersection(b), ax=ax, color=BLUE)
ax.set_title(f'is_intersected:{is_intersected(x1, y1, x2, y2, x3, y3, x4, y4)}')
set_limits(ax, 0, 4, 0, 4)ax = fig.add_subplot(4, 4, 5)
x1, y1, x2, y2 = 1, 1, 3, 1
x3, y3, x4, y4 = 1, 3, 1, 2
a = LineString([(x1, y1), (x2, y2)])
b = LineString([(x3, y3), (x4, y4)])
plot_line(a, ax=ax, color=GRAY)
plot_line(b, ax=ax, color=GRAY)
plot_points(a.intersection(b), ax=ax, color=BLUE)
ax.set_title(f'is_intersected:{is_intersected(x1, y1, x2, y2, x3, y3, x4, y4)}')
set_limits(ax, 0, 4, 0, 4)ax = fig.add_subplot(4, 4, 6)
x1, y1, x2, y2 = 2, 1, 3, 1
x3, y3, x4, y4 = 1, 3, 1, 2
a = LineString([(x1, y1), (x2, y2)])
b = LineString([(x3, y3), (x4, y4)])
plot_line(a, ax=ax, color=GRAY)
plot_line(b, ax=ax, color=GRAY)
plot_points(a.intersection(b), ax=ax, color=BLUE)
ax.set_title(f'is_intersected:{is_intersected(x1, y1, x2, y2, x3, y3, x4, y4)}')
set_limits(ax, 0, 4, 0, 4)ax = fig.add_subplot(4, 4, 7)
x1, y1, x2, y2 = 2, 1, 3, 1
x3, y3, x4, y4 = 1, 3, 1, 1
a = LineString([(x1, y1), (x2, y2)])
b = LineString([(x3, y3), (x4, y4)])
plot_line(a, ax=ax, color=GRAY)
plot_line(b, ax=ax, color=GRAY)
plot_points(a.intersection(b), ax=ax, color=BLUE)
ax.set_title(f'is_intersected:{is_intersected(x1, y1, x2, y2, x3, y3, x4, y4)}')
set_limits(ax, 0, 4, 0, 4)ax = fig.add_subplot(4, 4, 8)
x1, y1, x2, y2 = 2, 2, 3, 1
x3, y3, x4, y4 = 1, 3, 1, 1
a = LineString([(x1, y1), (x2, y2)])
b = LineString([(x3, y3), (x4, y4)])
plot_line(a, ax=ax, color=GRAY)
plot_line(b, ax=ax, color=GRAY)
plot_points(a.intersection(b), ax=ax, color=BLUE)
ax.set_title(f'is_intersected:{is_intersected(x1, y1, x2, y2, x3, y3, x4, y4)}')
set_limits(ax, 0, 4, 0, 4)ax = fig.add_subplot(4, 4, 9)
x1, y1, x2, y2 = 1, 2, 3, 1
x3, y3, x4, y4 = 1, 3, 1, 1
a = LineString([(x1, y1), (x2, y2)])
b = LineString([(x3, y3), (x4, y4)])
plot_line(a, ax=ax, color=GRAY)
plot_line(b, ax=ax, color=GRAY)
plot_points(a.intersection(b), ax=ax, color=BLUE)
ax.set_title(f'is_intersected:{is_intersected(x1, y1, x2, y2, x3, y3, x4, y4)}')
set_limits(ax, 0, 4, 0, 4)ax = fig.add_subplot(4, 4, 10)
x1, y1, x2, y2 = 1, 2, 3, 2
x3, y3, x4, y4 = 1, 3, 1, 1
a = LineString([(x1, y1), (x2, y2)])
b = LineString([(x3, y3), (x4, y4)])
plot_line(a, ax=ax, color=GRAY)
plot_line(b, ax=ax, color=GRAY)
plot_points(a.intersection(b), ax=ax, color=BLUE)
ax.set_title(f'is_intersected:{is_intersected(x1, y1, x2, y2, x3, y3, x4, y4)}')
set_limits(ax, 0, 4, 0, 4)ax = fig.add_subplot(4, 4, 11)
x1, y1, x2, y2 = 2, 2, 3, 2
x3, y3, x4, y4 = 1, 3, 1, 1
a = LineString([(x1, y1), (x2, y2)])
b = LineString([(x3, y3), (x4, y4)])
plot_line(a, ax=ax, color=GRAY)
plot_line(b, ax=ax, color=GRAY)
plot_points(a.intersection(b), ax=ax, color=BLUE)
ax.set_title(f'is_intersected:{is_intersected(x1, y1, x2, y2, x3, y3, x4, y4)}')
set_limits(ax, 0, 4, 0, 4)ax = fig.add_subplot(4, 4, 12)
x1, y1, x2, y2 = 2, 2, 3, 2
x3, y3, x4, y4 = 2, 3, 1, 1
a = LineString([(x1, y1), (x2, y2)])
b = LineString([(x3, y3), (x4, y4)])
plot_line(a, ax=ax, color=GRAY)
plot_line(b, ax=ax, color=GRAY)
plot_points(a.intersection(b), ax=ax, color=BLUE)
ax.set_title(f'is_intersected:{is_intersected(x1, y1, x2, y2, x3, y3, x4, y4)}')
set_limits(ax, 0, 4, 0, 4)ax = fig.add_subplot(4, 4, 13)
x1, y1, x2, y2 = 2, 2, 3, 2
x3, y3, x4, y4 = 3, 3, 1, 1
a = LineString([(x1, y1), (x2, y2)])
b = LineString([(x3, y3), (x4, y4)])
plot_line(a, ax=ax, color=GRAY)
plot_line(b, ax=ax, color=GRAY)
plot_points(a.intersection(b), ax=ax, color=BLUE)
ax.set_title(f'is_intersected:{is_intersected(x1, y1, x2, y2, x3, y3, x4, y4)}')
set_limits(ax, 0, 4, 0, 4)ax = fig.add_subplot(4, 4, 14)
x1, y1, x2, y2 = 1, 2, 3, 2
x3, y3, x4, y4 = 3, 3, 1, 1
a = LineString([(x1, y1), (x2, y2)])
b = LineString([(x3, y3), (x4, y4)])
plot_line(a, ax=ax, color=GRAY)
plot_line(b, ax=ax, color=GRAY)
plot_points(a.intersection(b), ax=ax, color=BLUE)
ax.set_title(f'is_intersected:{is_intersected(x1, y1, x2, y2, x3, y3, x4, y4)}')
set_limits(ax, 0, 4, 0, 4)ax = fig.add_subplot(4, 4, 15)
x1, y1, x2, y2 = 2, 1, 3, 1
x3, y3, x4, y4 = 1, 3, 3, 3
a = LineString([(x1, y1), (x2, y2)])
b = LineString([(x3, y3), (x4, y4)])
plot_line(a, ax=ax, color=GRAY)
plot_line(b, ax=ax, color=GRAY)
plot_points(a.intersection(b), ax=ax, color=BLUE)
ax.set_title(f'is_intersected:{is_intersected(x1, y1, x2, y2, x3, y3, x4, y4)}')
set_limits(ax, 0, 4, 0, 4)ax = fig.add_subplot(4, 4, 16)
x1, y1, x2, y2 = 1, 1, 3, 1
x3, y3, x4, y4 = 1, 3, 3, 3
a = LineString([(x1, y1), (x2, y2)])
b = LineString([(x3, y3), (x4, y4)])
plot_line(a, ax=ax, color=GRAY)
plot_line(b, ax=ax, color=GRAY)
plot_points(a.intersection(b), ax=ax, color=BLUE)
ax.set_title(f'is_intersected:{is_intersected(x1, y1, x2, y2, x3, y3, x4, y4)}')
set_limits(ax, 0, 4, 0, 4)plt.savefig('output.png')
plt.show()
测试结果
C++: 0.0157648 s
Python(numba): 1.3376786708831787 s
Python(no numba): 3.585803985595703 s
Python(shapely): 73.45080494880676 s